
Plutonium pagination: when the slowest query in your Rails admin is the count
An admin index page in a production Plutonium app started returning 500s. The table behind it had about fourteen million rows, Postgres was cancelling the request at its 15 second statement timeout, and the page had never been slow before the table got big.
The obvious culprit was real. The page sorts by created_at and the column had no index, so every load was a parallel sequential scan followed by a sort. Add the index and that query drops to milliseconds, because Postgres can walk the index backwards and stop after twenty rows.
But an index page runs two queries, and the index only fixes one of them.
The second query
Before Plutonium fetches the page of records, it counts them. The count feeds three things on the page: the footer ("Displaying Transactions 1-20 of 13742118 in total"), the result count above the table, and the numbered page links, which need to know where the last page is.
SELECT COUNT(*) FROM "transactions"Rails strips the ORDER BY from a count, so the new index on created_at is no help here. And COUNT(*) on Postgres cannot read a stored total: rows carry their own visibility information, so the only way to know how many rows this transaction can see is to look at all of them. The best case is an index-only scan over the smallest index, which is still one entry per row. Fourteen million rows means seconds of work, on every page load, every filter change, and every click on "next".
The total is also the least useful number on the page. Nobody reads "13742118" and does anything differently than they would with "more than ten thousand".
Cap it
Plutonium 0.70 adds a pagination setting to the definition:
class TransactionDefinition < ResourceDefinition
  pagination count: 10_000
end
With a cap, the count runs over a subquery with a LIMIT:
SELECT COUNT(*) FROM (SELECT 1 AS one FROM "transactions" LIMIT 10001) AS subquery_for_countPostgres stops after 10,001 rows instead of fourteen million. The extra row is how Plutonium knows the total went past the cap: below it, the page shows the exact number; past it, the total reads "10000+".
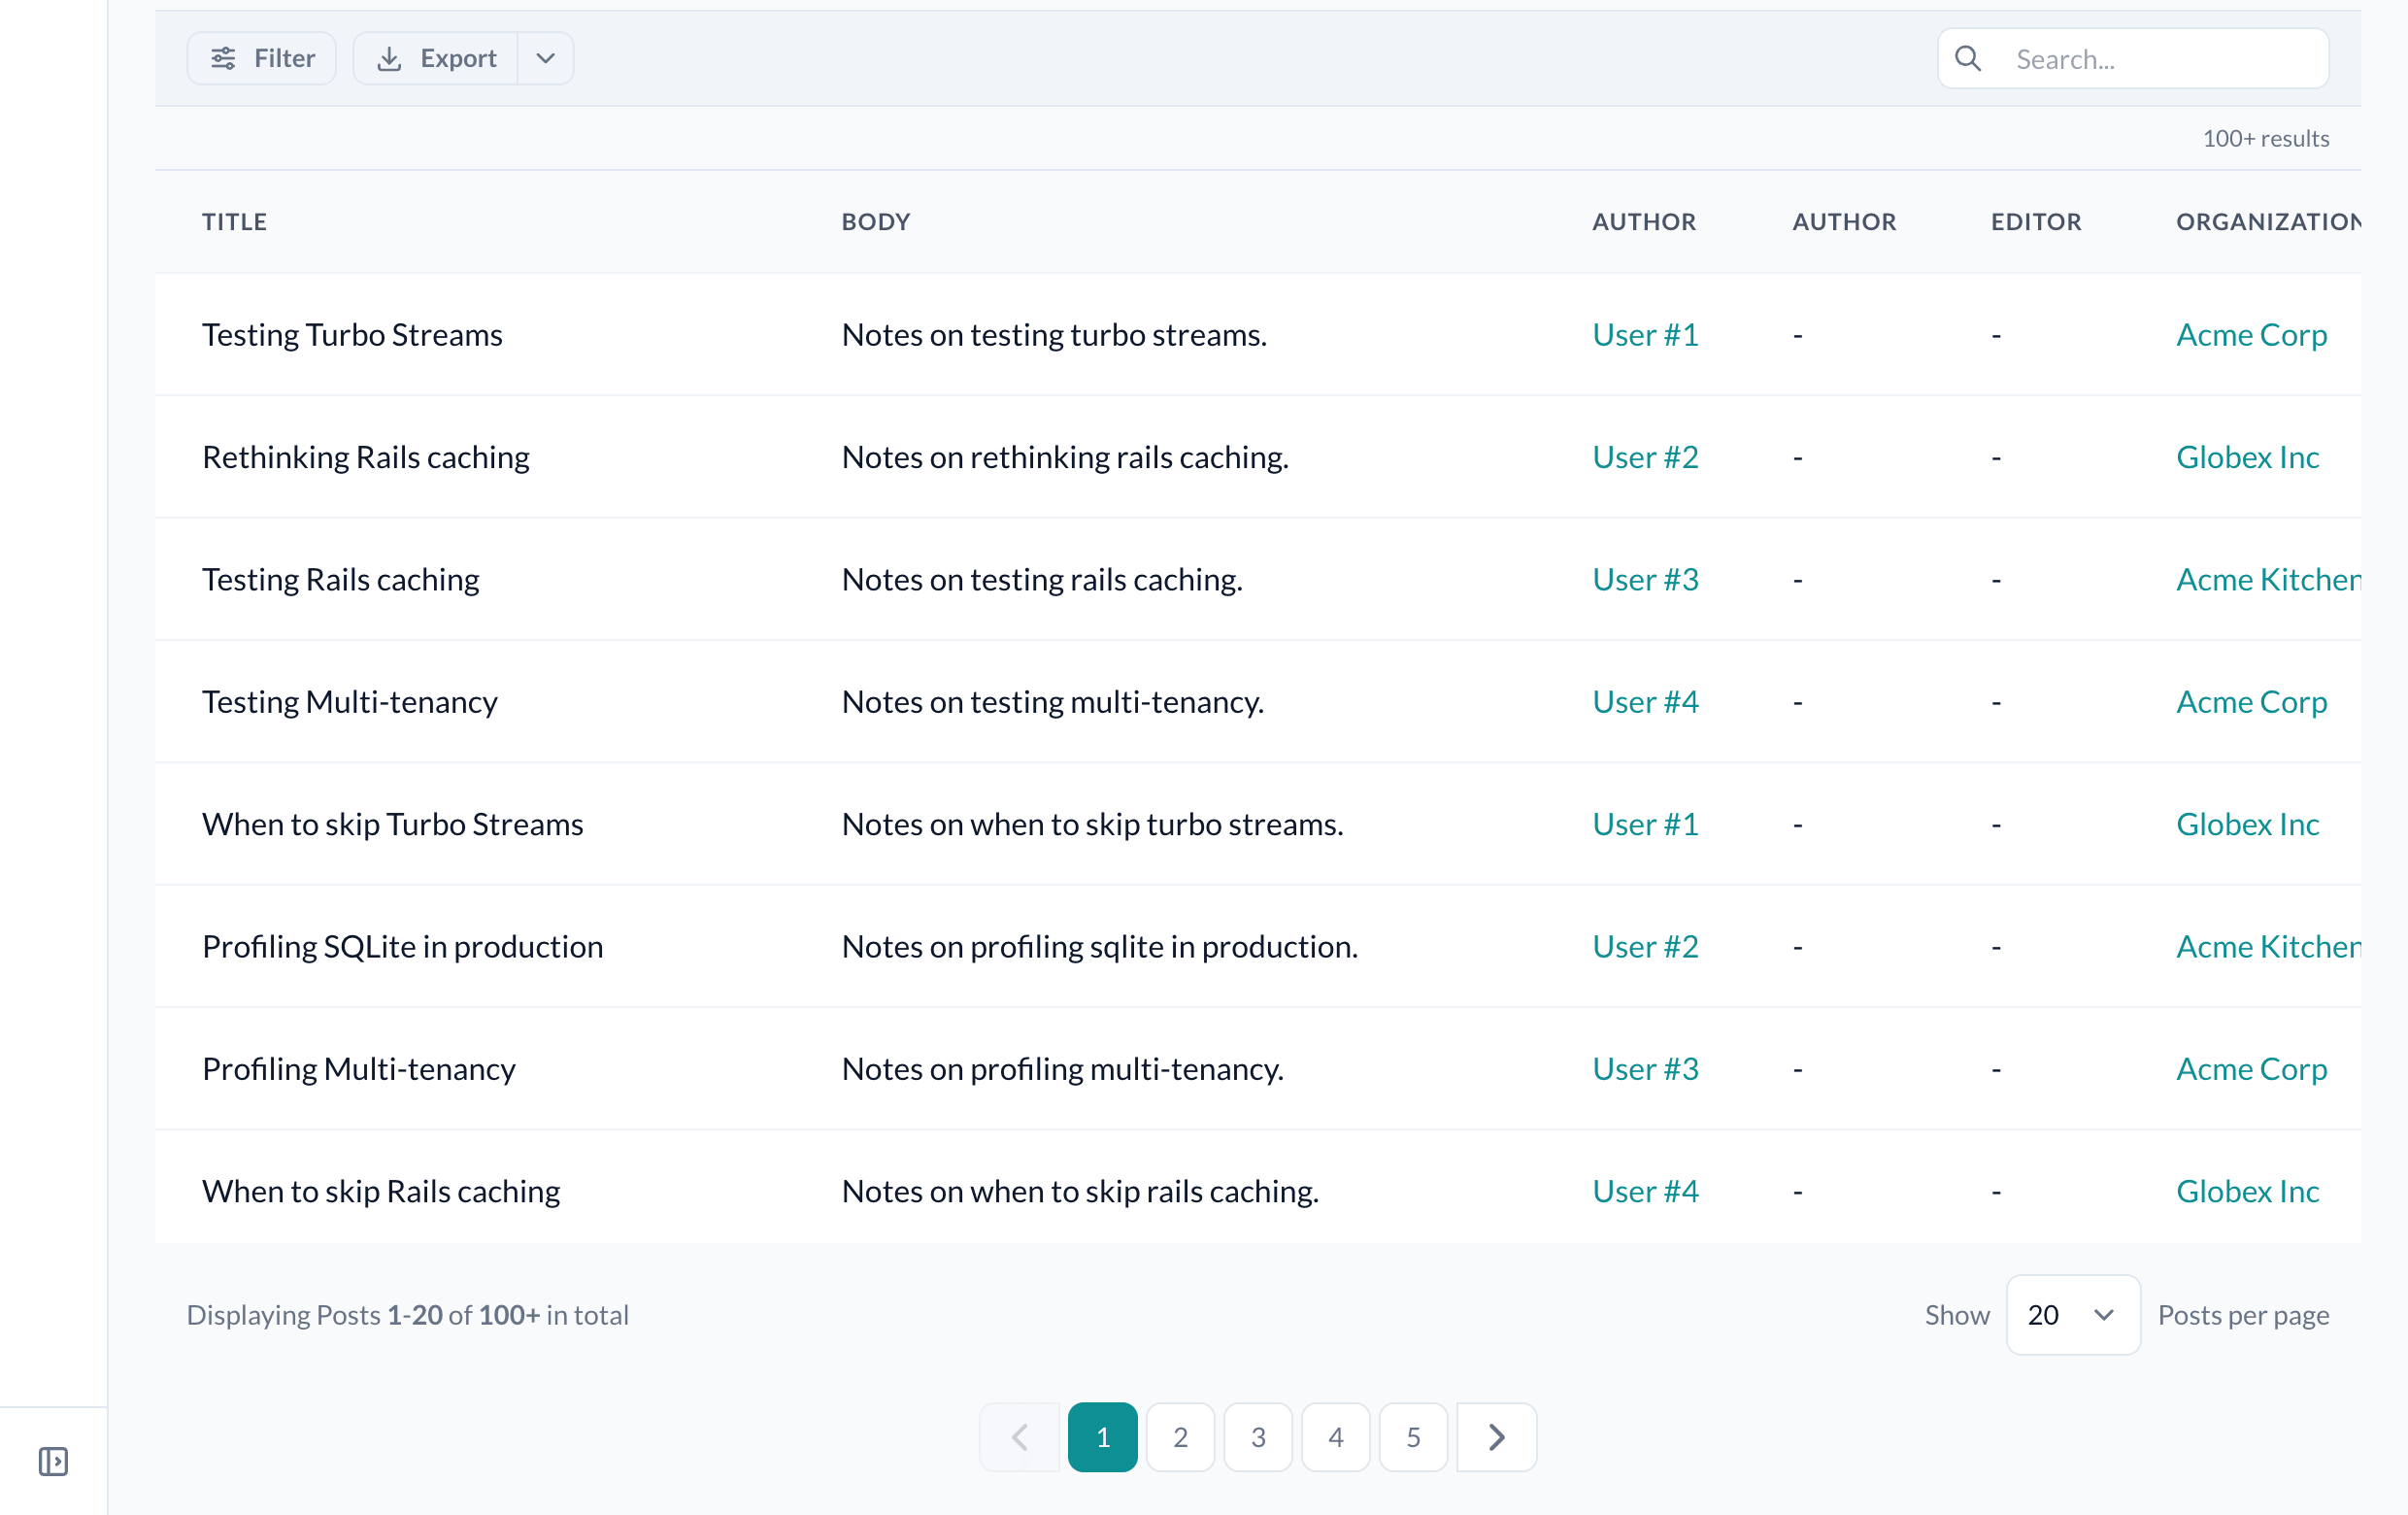
The pager links pages up to the one holding row 10,000, and stops there. That is deliberate. A deep OFFSET has the same problem as the count, since the database reads and discards every skipped row, so page 500,000 of a transaction log was never a page anyone should be able to request.
Or skip it
Some lists do not need a total at all. An audit log is read from the top, and the useful navigation is "older":
class AuditLogDefinition < ResourceDefinition
  pagination count: false
end
No count query runs. The page fetches one more row than it shows, and that extra row decides whether there is a next page. The footer drops the "of N", and the pager offers previous, next, and the pages visited so far.

A list that fits on one page still shows its total, because the rows on the page are the whole set.
What a cap does not fix
A capped count is cheap when lots of rows match, because the subquery fills its 10,001 slots quickly. It is no cheaper when few rows match.
Say a "Pending" tab matches 400 rows and status has no index. The capped subquery still scans the whole table looking for a 10,001st row that does not exist, so it costs about what the full count did. The page query has the same problem: walking the created_at index backwards for twenty pending rows means stepping over every non-pending row on the way.
The fix for that tab is an index on the filtered column, a partial one if a single value is the hot path. The cap removes the cost of counting rows you were never going to look at. It cannot remove the cost of finding the ones you are.
Deciding per request
The definition sets a resource's default. When the right answer depends on the request, override pagination_count in the controller. It returns the same values the definition takes:
class TransactionsController < ResourceController
  private

  def pagination_count
    current_query_object.active_filter_descriptions.empty? ? false : 10_000
  end
end
Here the unfiltered list skips the count entirely, and a filtered one gets a capped total.
Defaults
Nothing changes unless you ask. The global default is an exact count, set in the initializer alongside the rest of Plutonium's configuration:
Plutonium.configure do |config|
  config.pagination = {count: :exact}
end
The "N+" wording and the countless range sentence are translation keys, so a localized app can override them like any other string.
Where to go next
- Definition › Pagination count: every value, the SQL each one runs, and the controller override.
- Performance: counting large tables, alongside eager loading and the search fallback.