
Introducing Plutonium dashboards: metric cards and charts for your Rails admin
Every portal Plutonium generates opens on a Dashboard page that lists your resources with a record count each. Anything past that, the numbers and charts an admin actually opens the app to see, was yours to build: a controller action, some instance variables, a view. Plutonium 0.65 ships it. A dashboard is a Ruby class of cards, mounted with one line in your routes.
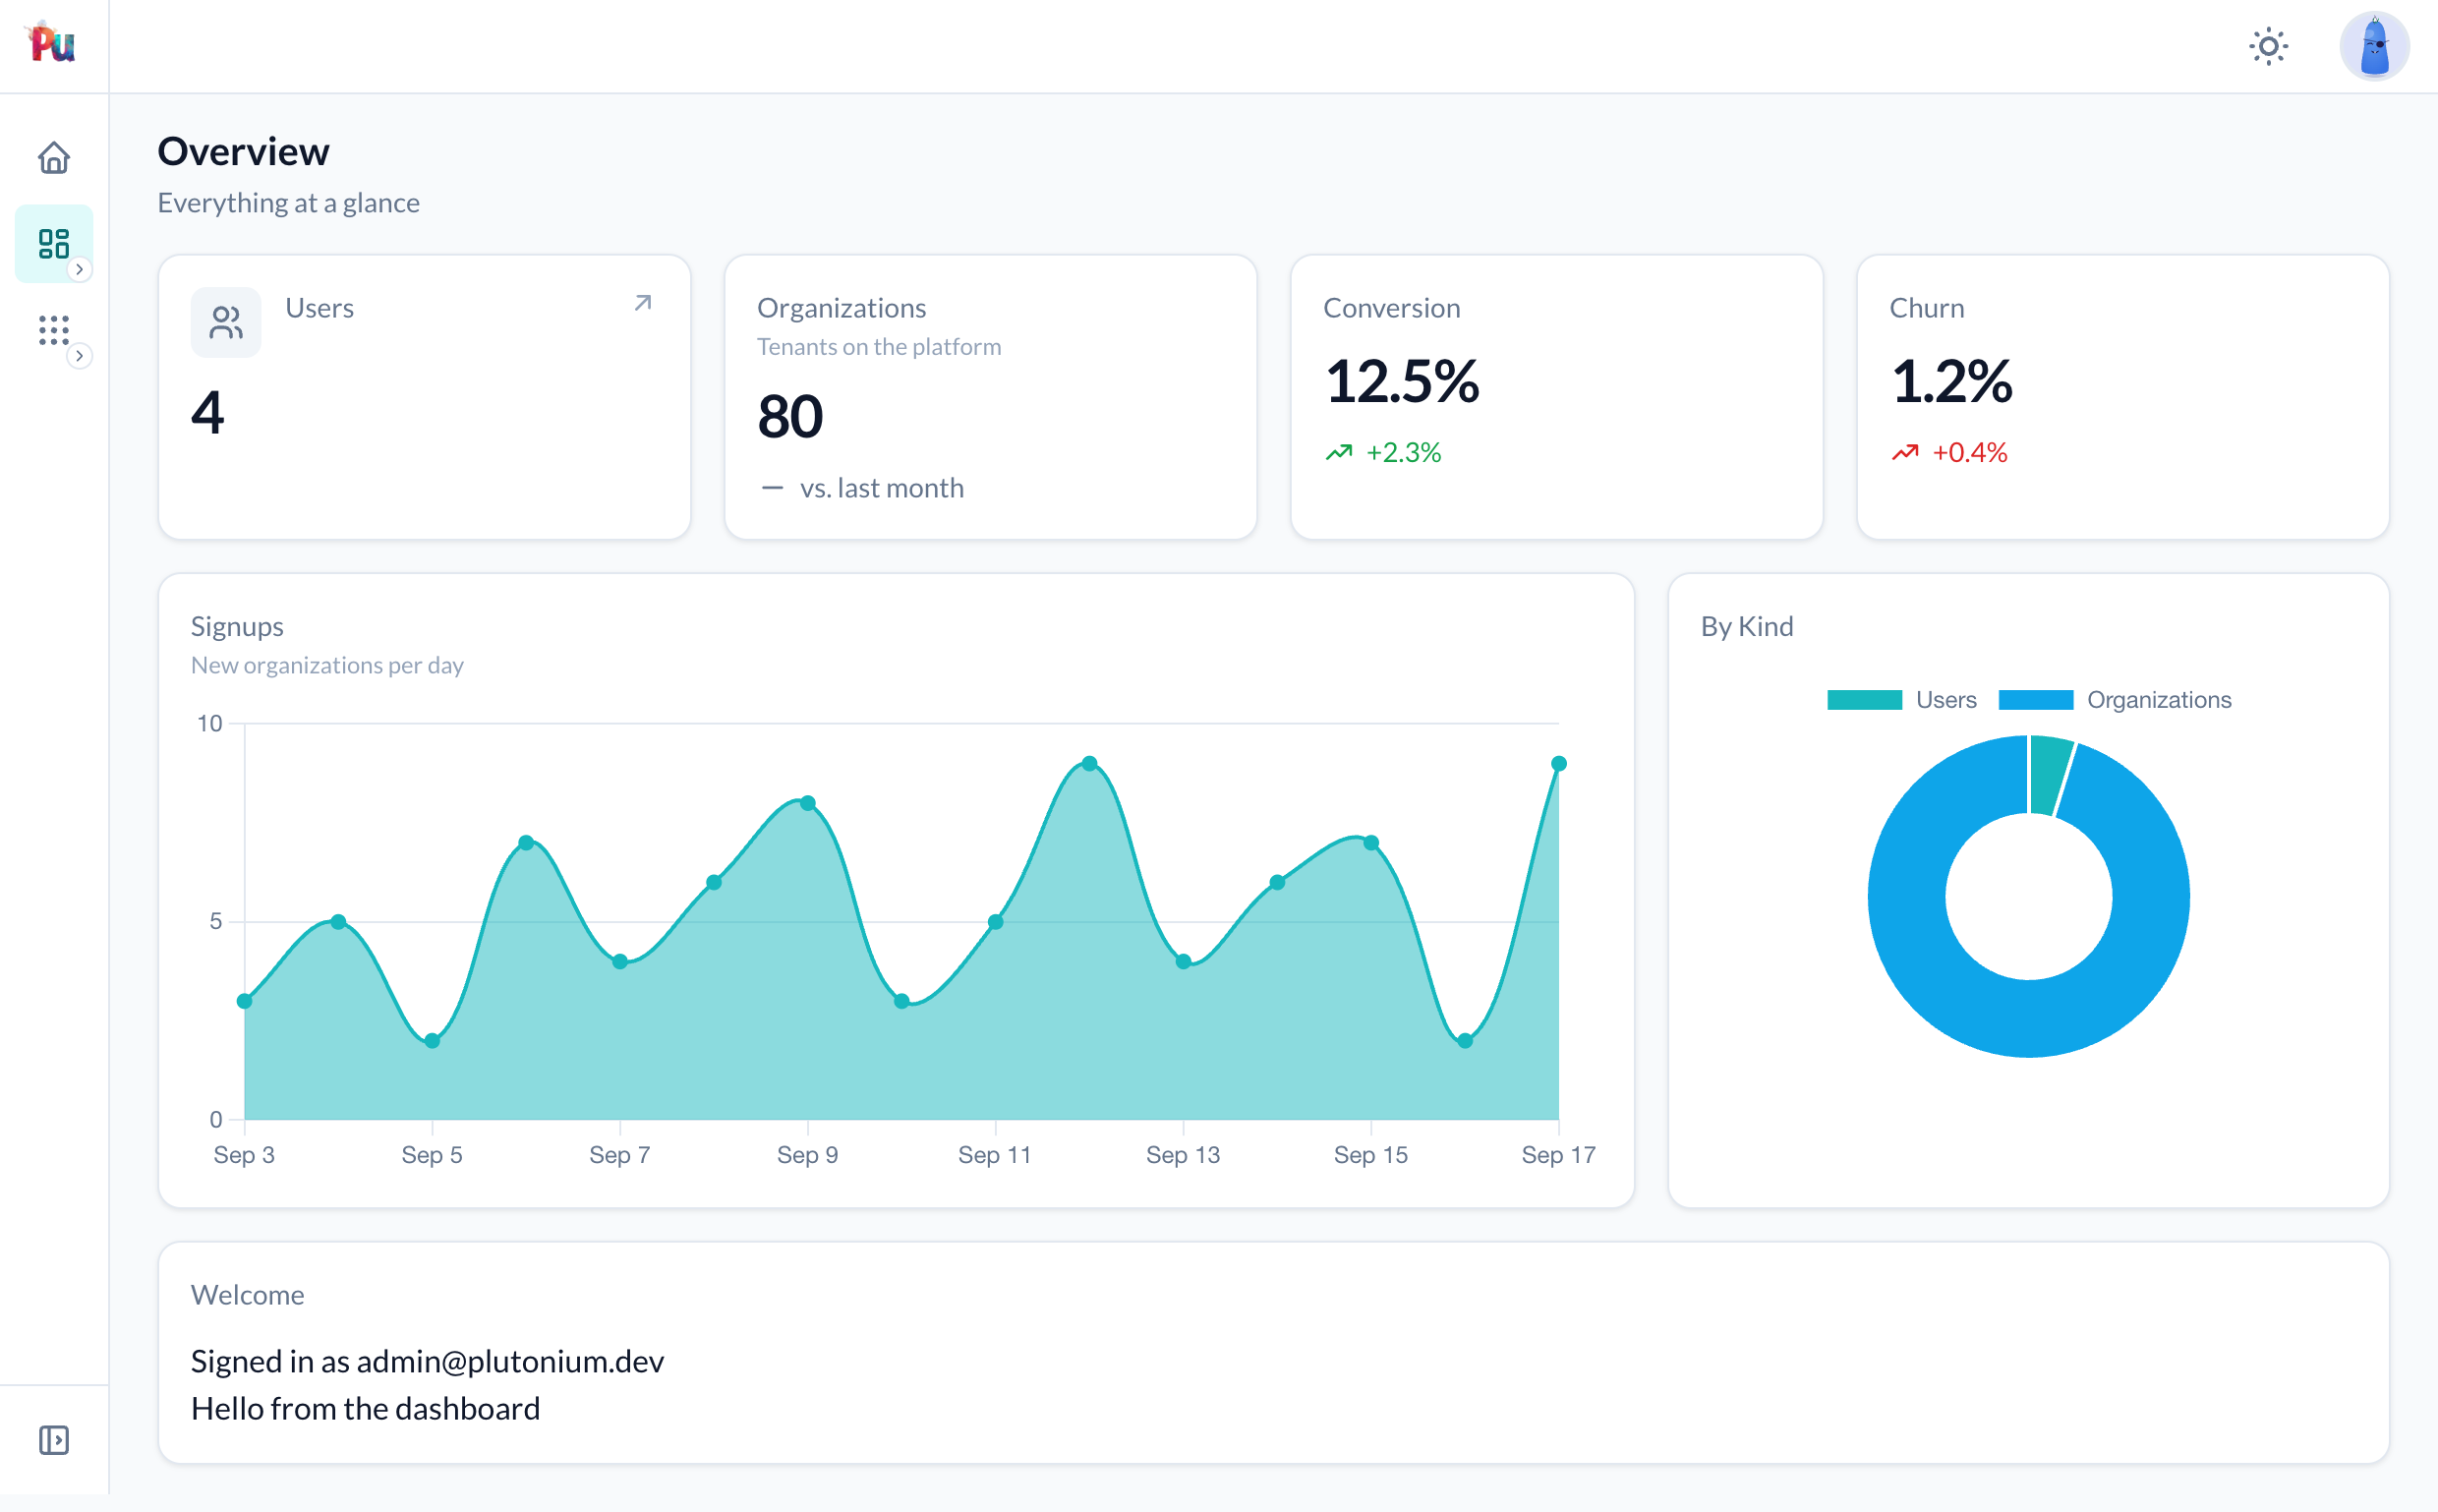
What's in the box
- A class-level DSL with three kinds of card:
metricfor headline numbers,chartfor charts,cardfor anything else. register_dashboard, which draws the routes and a controller that inherits your portal's authentication, tenant scoping and layout.- Lazy loading: by default every card is fetched in its own turbo frame, behind a skeleton.
- A 12-column grid with a default width per kind of card, plus per-card refresh intervals, conditions, links and icons.
- A
pu:dashboardgenerator, and a Dashboards group in the portal sidebar.
Generate one
rails g pu:dashboard Sales --dest=admin_portalThis writes packages/admin_portal/app/dashboards/admin_portal/sales_dashboard.rb and adds the registration to the portal's routes:
AdminPortal::Engine.routes.draw do
  register_dashboard AdminPortal::SalesDashboard, at: "sales"
end
The page is served at /admin/dashboards/sales. Pass --at=/ instead and the dashboard becomes the portal's root page, replacing the generated root to: "dashboard#index" (the old DashboardController and its view can then go).
Declare the cards
module AdminPortal
  class SalesDashboard < Plutonium::Dashboard::Base
    presents label: "Sales", icon: Phlex::TablerIcons::ChartBar

    refresh 60

    metric(:orders, icon: Phlex::TablerIcons::ShoppingCart, href: -> { resource_url_for(Order, parent: nil) }) do
      {value: orders.where(created_at: 30.days.ago..).count,
       previous: orders.where(created_at: 60.days.ago...30.days.ago).count,
       change_label: "vs. previous 30 days"}
    end

    metric(:revenue, format: :currency) { orders.sum(:total) }

    metric(:refund_rate, format: :percentage, precision: 1, positive: :down) do
      {value: 2.1, previous: 1.8}
    end

    chart(:orders_per_day, type: :area, span: 8) do
      orders.pluck(:created_at).map(&:to_date).tally.sort.to_h
    end

    chart(:by_status, type: :donut, span: 4) { orders.group(:status).count }

    card(:latest, span: :full) do
      ul { latest_orders.each { |order| li { order.number } } }
    end

    private

    def orders = authorized_resource_scope(Order)

    def latest_orders = orders.order(created_at: :desc).limit(5)
  end
end
Metrics. The block returns a number, or a hash. Give it a previous value and the card computes the percentage change and shows it with a trend arrow. format: is :number, :currency, :percentage, :human (1.23 Million) or a proc. positive: :down says a falling number is the good direction, so the refund rate above, up from 1.8 to 2.1, is styled as bad news.
Charts. The block returns Chartkick data: a hash, an array of pairs, or an array of named series. type: is :line, :area, :column, :bar, :pie, :donut or :scatter, and every other option passes straight through to Chartkick.
Custom cards. The block renders Phlex markup inside the card, for a recent-activity list, a call to action, or whatever the first two do not cover.
Layout. The grid is 12 columns wide, so halves, thirds and quarters can share a dashboard. span: says how many a card takes. Left out, a metric takes 3 (four to a row) and a chart or custom card takes 6. Above, the area chart takes two thirds of its row and the donut the remaining third. Tablets drop to two columns and phones to one.
Blocks run on the dashboard instance, so private methods are how cards share a query. authorized_resource_scope(Order) is the same policy scope your resource pages use: the dashboard counts what this user may see, in this tenant, without restating either rule.
Every card loads on its own
The page response contains no query results. Each card renders as a lazy turbo frame holding a skeleton:
<turbo-frame id="pu-dashboard-card-orders" src="/admin/dashboards/sales/cards/orders" loading="lazy">The browser fetches each frame as it scrolls into view, and the card's block runs in that request. The page paints at once, the cheap cards fill in first, and one expensive aggregate delays itself and nothing else.
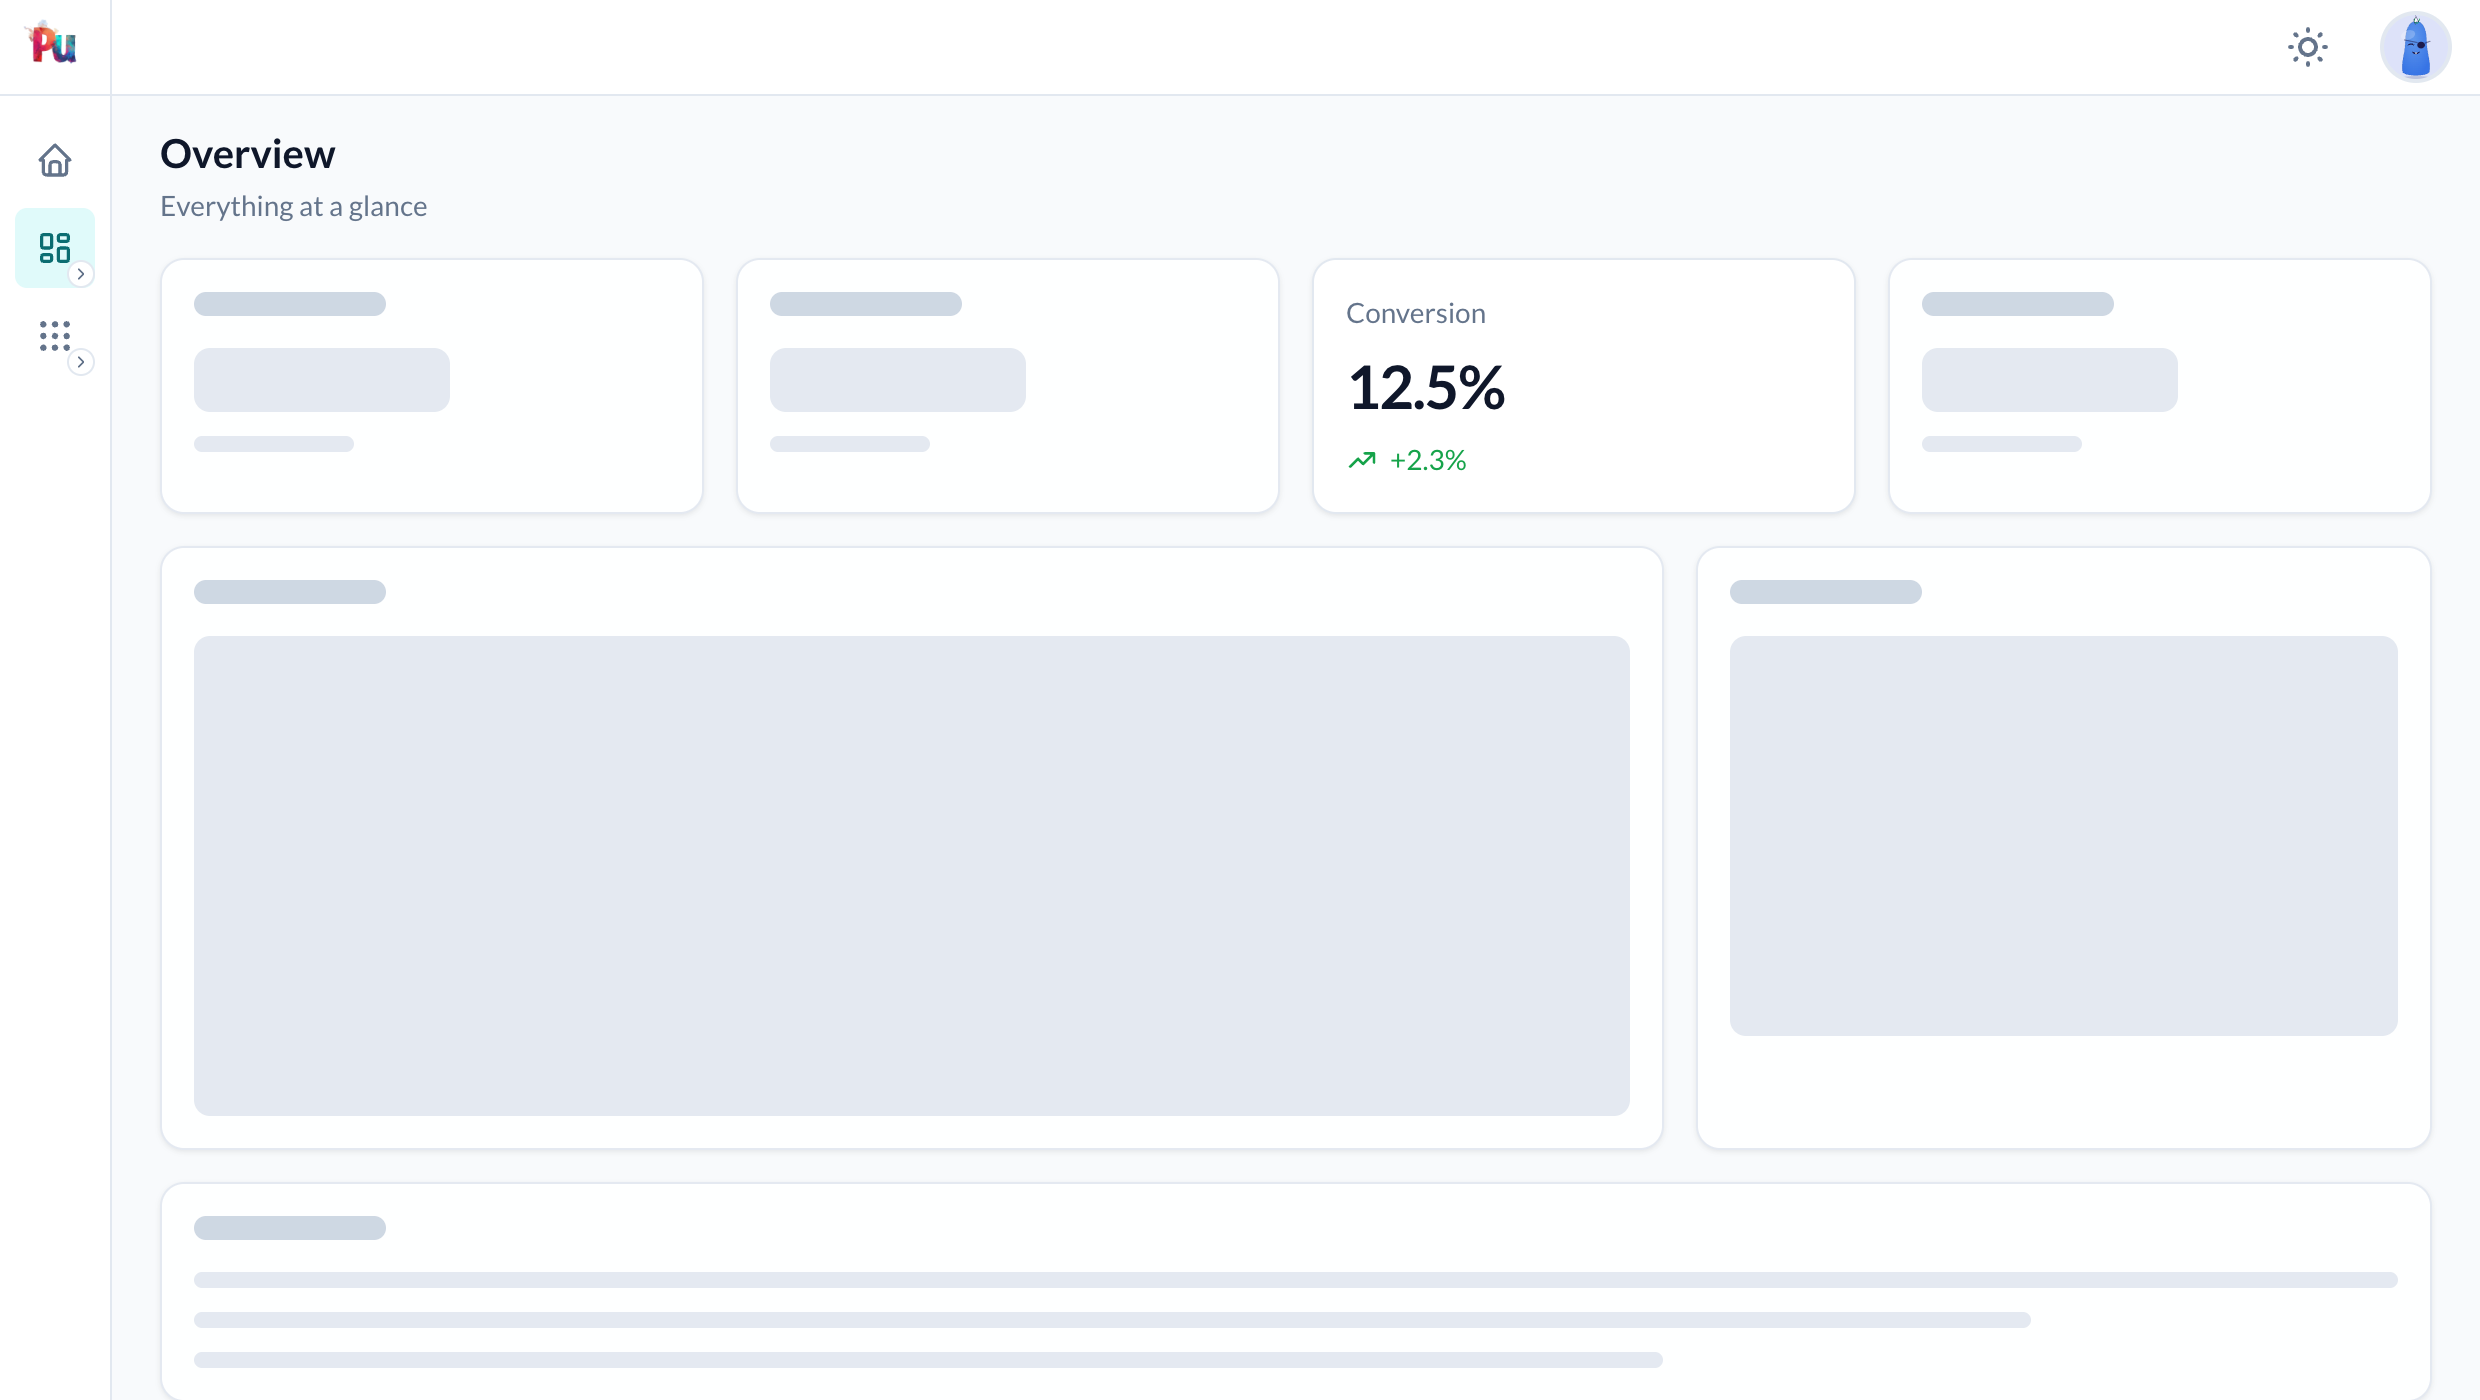
The Conversion card in that screenshot is declared lazy: false, which makes it inline: its block runs in the page request and the finished card is part of the page response, with no frame, no skeleton and no second request. The price is that the page waits for it. Use it for a number cheap enough that a round trip costs more than the query, and leave everything else lazy. An inline card never refreshes, since there is no frame to reload, and in development and test an exception in its block fails the whole page rather than one frame.
refresh 60 on the dashboard reloads every lazy card once a minute. refresh: 10 on a card overrides it, and refresh: false keeps an expensive card out of it. Reloads pause while the tab is hidden and catch up when it becomes visible again, so a dashboard left open overnight is not running your aggregates all night.
Who sees what
A portal dashboard sits behind the portal's login like every other page. To restrict it further, override authorize?; a false answer is a 403 from the page and from every card URL.
def authorize? = current_user.admin?condition: hides a single card. Because a card is an endpoint, the condition guards the endpoint too: a hidden card responds 404, so it cannot be fetched by guessing its key.
metric(:margin, format: :percentage, condition: -> { current_user.admin? }) { margin }On an entity-scoped portal the page and card URLs carry the tenant segment (/org/1/dashboards/team) and current_scoped_entity is available in every block:
class TeamDashboard < Plutonium::Dashboard::Base
  metric(:members) { current_scoped_entity.memberships.count }
end
When a card breaks
In development and test a card that raises, raises, and you fix the query. In production the card shows a short notice in place of its body and the rest of the dashboard is untouched.
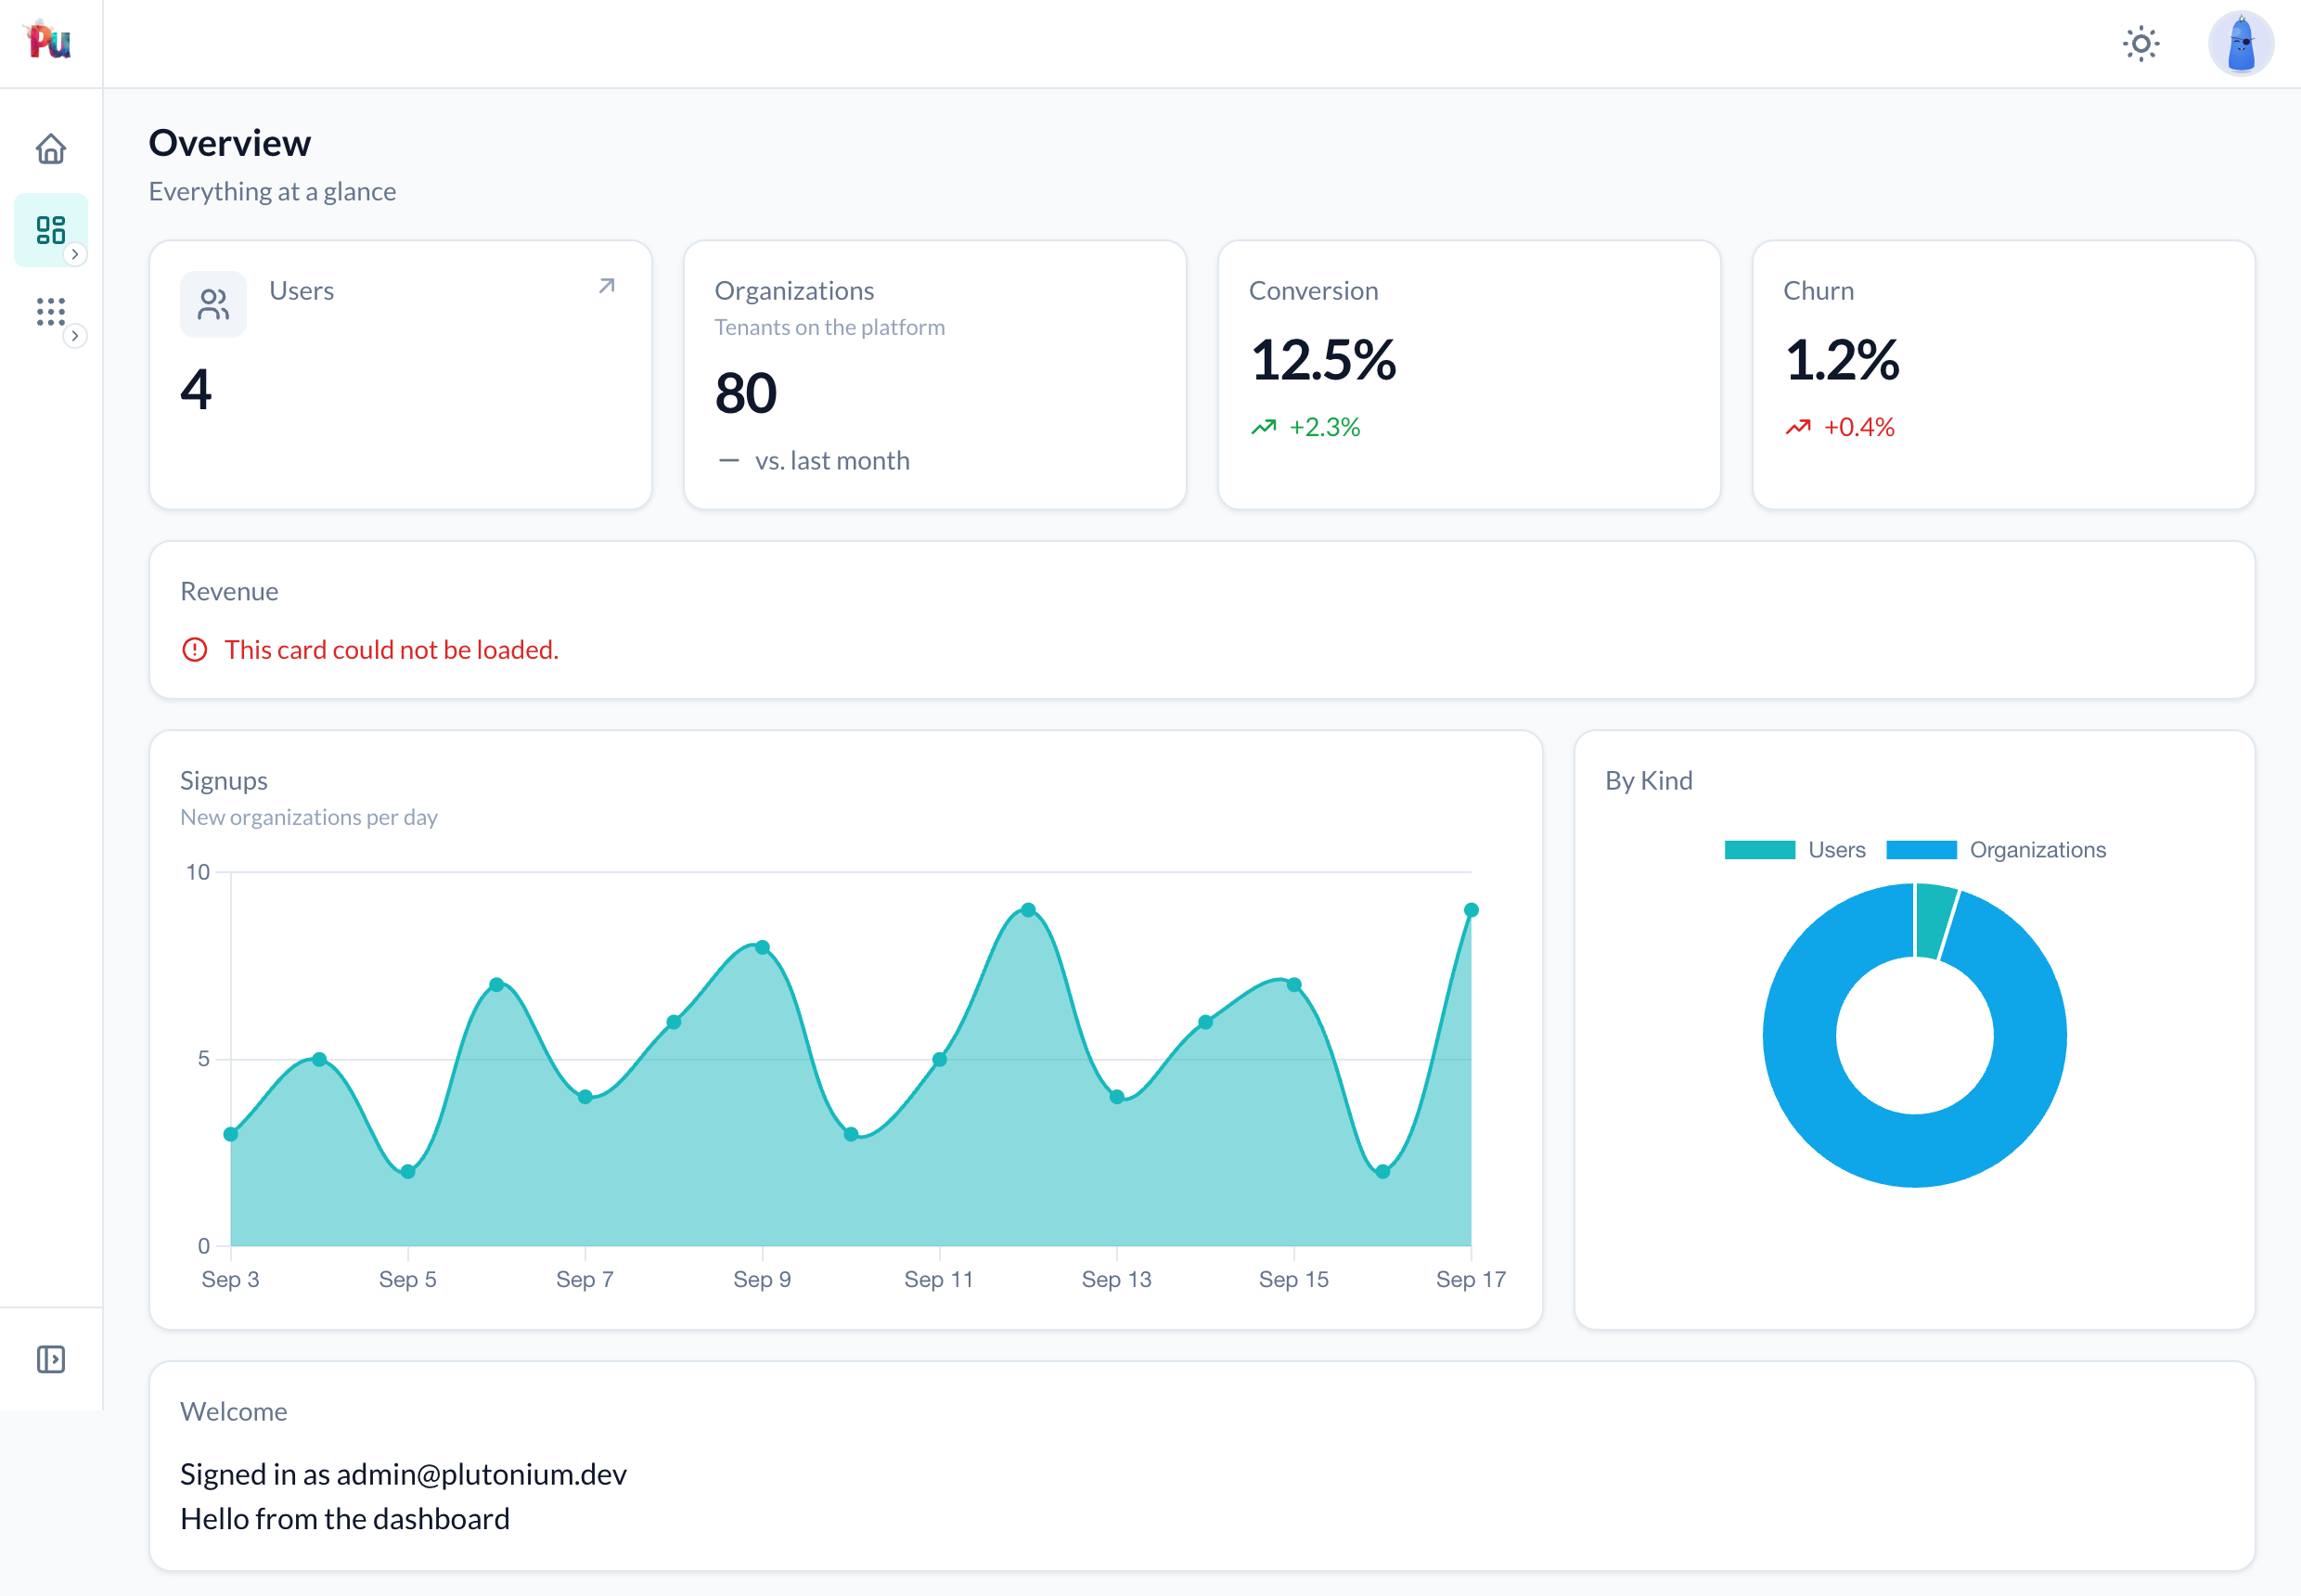
The failure is written to the Rails log with the dashboard class, the card key and the top of the backtrace, and it is reported through Rails.error:
Rails.error.report(
  error,
  handled: true,
  source: "plutonium.dashboard",
  context: {dashboard: "AdminPortal::SalesDashboard", card: "revenue"}
)
Both happen because Rails.error.report notifies subscribers and writes nothing to the log. An app with no error tracker still gets a log line; an app with Sentry, Honeybadger or AppSignal subscribed gets a handled error it can group by card and alert on.
Charts without the bundle tax
Charts render with Chart.js through Chartkick, which is a lot of JavaScript for an app where most pages are tables and forms. It ships as a separate bundle. A chart card carries the bundle's URL in a data attribute and the chart Stimulus controller injects the script the first time a chart connects, so pages without a chart never download it.
Series colours come from the --pu-chart-1 to --pu-chart-8 design tokens and are re-read when the colour mode flips. Charts follow your theme in light and dark mode with no per-chart configuration.
In the sidebar
Registered dashboards are grouped under a Dashboards item in the portal sidebar, with a link per dashboard. A dashboard mounted at the root is what the Home link opens, so it stays out of the group.
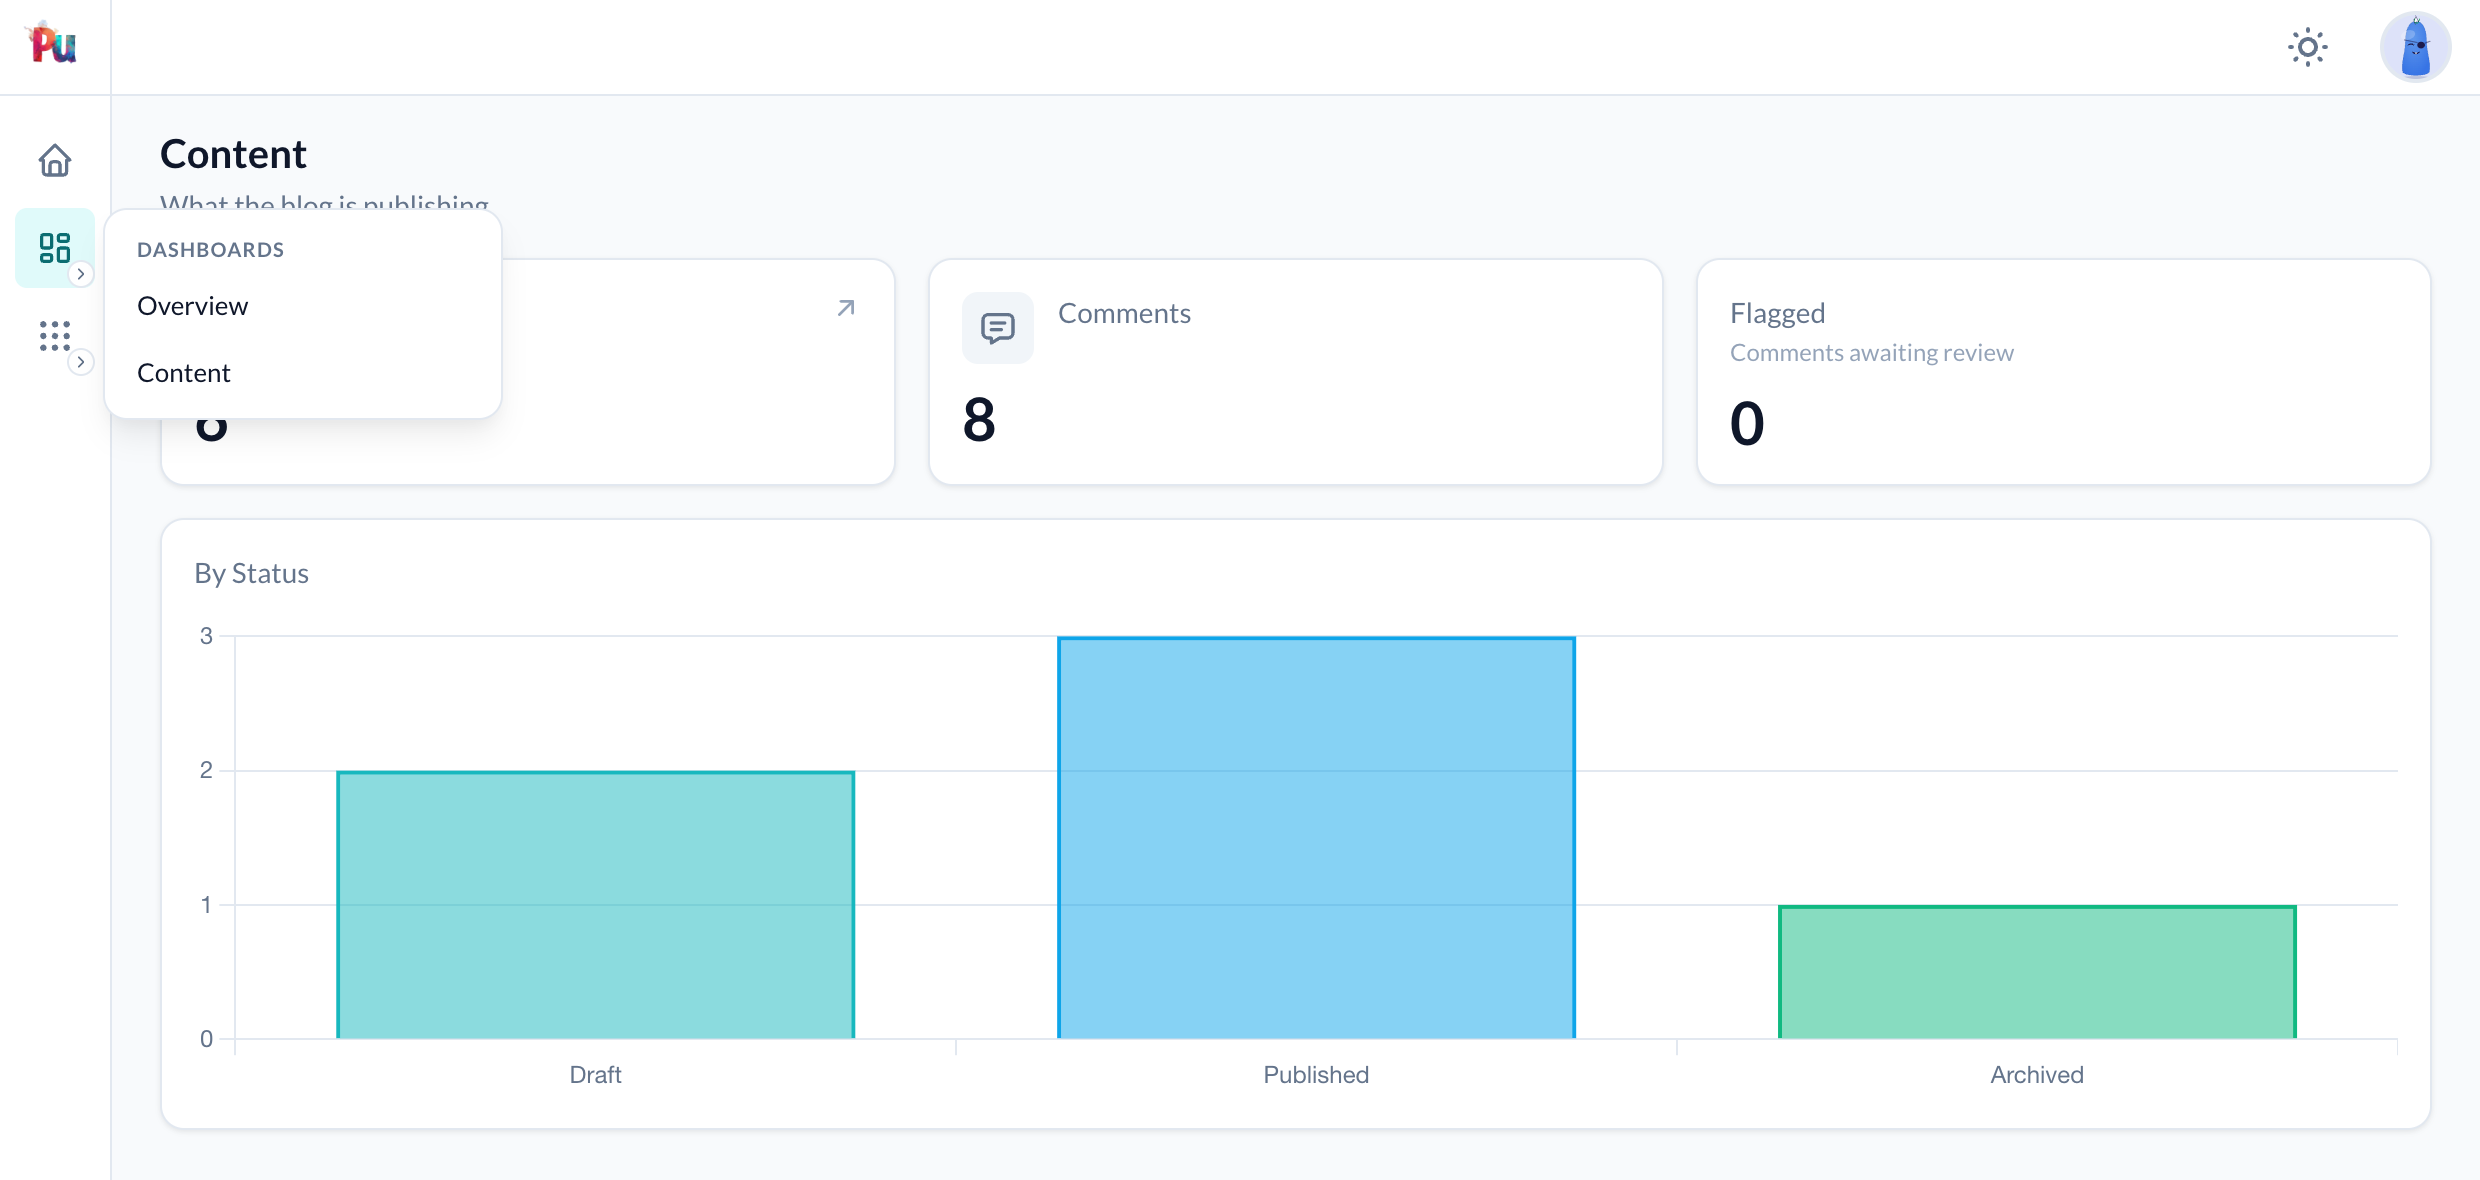
If your portal has an ejected _resource_sidebar.html.erb from an earlier release, the guide has the block to add.
A note on URLs
Every dashboard is drawn under a dashboards/ segment. A portal's URL space already belongs to register_resource, and a dashboard at a bare /admin/sales is one Sale model away from a route collision that Rails resolves silently, by order. If you want the bare path anyway, prefix: nil turns the segment off for that mount.
Experimental, for now
Dashboards ship marked experimental, like kanban, wizards and async interactions: fine to build on, but the DSL may still move before 1.0. If the API fights you, tell me. That feedback still changes things.
Where to go next
- Dashboards guide: the worked example, every card option, layout and translations.
- Dashboard reference: the DSL,
register_dashboardand the routes it draws, and the generator.